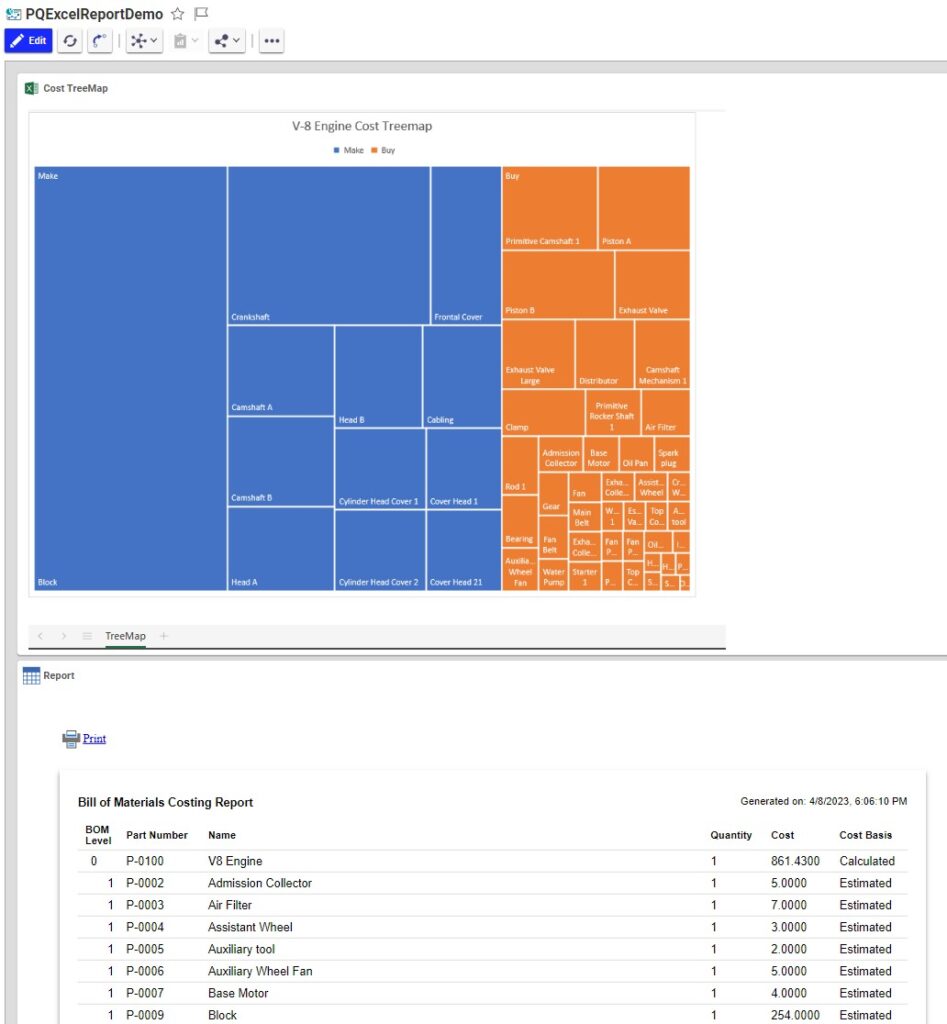
This post was started about a year ago about embedded Power BI reports. But then Dashboards were announced, now in Free 23. Here is an Aras Innovator® Dashboard using Power Query, Query Builder and REST API to put an Excel online chart in a Report.
This is how it is done:
- Demo data is from a GrabCAD model
- The Excel file is embedded from MS365. It can also be used in an iframe on a Form.
- Excel gathers data using Power Query, which calls the REST API using an OData Action to call a Method.
- The method calls PE_costingReport QB (modified to get make_buy value).
- A client Report returns the embedded iframe.
- Dashboard has two report widgets, to show Excel and the Costing Report.
Aras Innovator® is a trademark of Aras Corporation.